| Updated: 15-Mar-2001 | NATO the first five years 1949-1954 |
|
Part 1
|
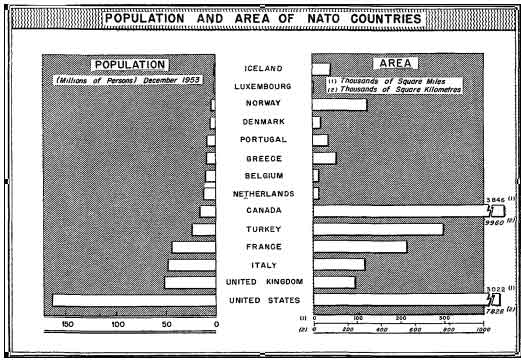
Population,
area and density of population
|
|||||||||||||||||||||||||||||||||||||||||||||||||||||||||||||||||||||||||||||||||||||||||||||||||||||||||||||||||
| Country |
Population December 1953 (Thousands) |
Area |
Density December 1953 |
||
| (Sq. Miles) | (Sq. Km.) | Persons per sq. Mile | Persons
per sq. Km. |
||
|
Belgium |
8.800 | 11.779 | 30.507 | 747.1 | 288.5 |
| Canada
|
15.005 | 3.845.632 | 9.960.170 | 3.9 | 1.5 |
| Denmark
|
4.384 | 16.578 | 42.936 | 264.4 | 102.1 |
| France
|
42.995 | 212.736 | 550.986 | 202.1 | 78 |
| Greece
|
8.220 | 51.182 | 132.562 | 160.6 | 62.0 |
| Iceland
|
152 | 39.768 | 103.000 | 3.8 | 1.5 |
| Italy
|
47.220 | 116.225 | 301.023 | 406.3 | 156.9 |
| Luxembourg
|
304 | 998 | 2.586 | 304.6 | 117.6 |
| Netherlands
|
10.550 | 12.505 | 32.388 | 843.6 | 325.7 |
| Norway
|
3.375 | 125.065 | 323.917 | 27.8 | 10.4 |
| Portugal
|
8.058 | 34.216 | 88.620 | 243.3 | 93.9 |
| Turkey
|
23.205 | 296.185 | 767.119 | 78.3 | 30.2 |
| United
Kingdom |
50.954 | 94.209 | 244.002 | 540.9 | 208.8 |
| United
States |
161.100 | 3.022.275 | 7.827.680 | 53.3 | 20.6 |
| NATO
Europe |
208.217 | 1.011.446 | 2.619.646 | 205.9 | 79.5 |
| NATO
North America |
176.105 | 6.867.907 | 17.787.85 | 25.6 | 9.9 |
| Total NATO | 384.322 | 7.879.353 | 20.407.49 | 48.8 | 18.8 |
Related chart:
Notes: